Publications

Publications At ASU

Coming Soon


Publications Prior to ASU

A scientific figure showing entropy's role in charge separation in 1D semiconductors. The top panel depicts a single-walled carbon nanotube (1D SWCNT) with a dodecaborane dopant molecule attached, showing charge transfer with a positive charge moving along the nanotube. The bottom panel shows a graph plotting binding potential (meV) versus distance along the SWCNT from the counterion (0-10 nm). Two curves are shown: a dashed cyan line labeled 'ΔE (no entropy)' that rises from about -200 meV to -50 meV, and a solid dark blue line labeled 'ΔG (with entropy)' that remains relatively flat around -170 meV, demonstrating how entropy considerations significantly affect the energetics of charge separation.
Advanced Materials (2025)

Revisiting The Role of Entropy for Charge Separation in 1D Pi-Conjugated Semiconductors

J.D. Earley, O.G. Reid, T.L. Murrey, E.A. Doud, A.M. Spokoyny, M.A. Hermosilla-Palacios, G. Rumbles, A.J. Ferguson, and J.L. Blackburn.

https://doi.org/10.1002/adma.202505044

A scientific figure showing dopant effects on graphene nanoribbons. The left panel displays three molecular dopant structures: F₄TCNQ (a planar organic molecule with fluorine and cyano groups), DDB-F₆₀ (a dodecaborate cage cluster connected to a fluorinated aromatic group), and DDB-F₆₀-bp (similar to DDB-F₆₀ but with a biphenyl linker). Each dopant is shown with its chemical structure and green polyhedral representations. The right panel shows a scatter plot correlating P1 Polaron Energy (eV, y-axis, 0.29-0.33) with Hole-Counterion Distance (nm, x-axis, 0.4-1.4). Three data points represent the dopants: F₄TCNQ (blue, top left), DDB-F₆₀ (green, middle), and DDB-F₆₀-bp (brown, bottom right). A diagonal arrow labeled 'Increasing GNR Hole Delocalization' shows the trend from F₄TCNQ to DDB-F₆₀-bp. An inset depicts a graphene nanoribbon structure, illustrating how increased hole-counterion separation leads to enhanced charge delocalization.
ACS Nano (2025)

Polaron Delocalization and Transport in Doped Graphene Nanoribbon Thin Films

M. A. Hermosilla-Palacios, S. Lindenthal, J. D. Earley, T. J. Aubry, D. DeLuca, H. Al Khunaizi, A. M. Spokoyny, J. Zaumseil, A. J. Ferguson, & J. L. Blackburn

https://doi.org/10.1021/acsnano.5c03888

A mechanistic diagram showing photolytic activation of nickel catalysis in cross-coupling reactions. The scheme illustrates how a photosensitizer (PS, shown as a blue circle with a lightbulb) gets excited by light to PS*, which then interacts with a Ni(II) complex bearing X ligands and a bulky tBu-substituted ligand framework. The Ni(II) center undergoes photoinduced reduction to generate Ni(I) (shown in orange), which then participates in the catalytic cycle. The diagram shows formation of radical intermediates (X• and R•) and ultimately leads to product formation (R-H and HX). Key structural elements include the sterically bulky tert-butyl groups on the ligand scaffold and the coordination environment around the nickel center, demonstrating how photochemistry initiates the catalytic process.
Nature Communications (2025)

Photolytic activation of Ni(II)X₂L explains how Ni-mediated cross coupling begins

M. Kudisch, R.X. Hooper, L.K. Valloli, J.D. Earley, A. Zieleniewska, J. Yu, S. DiLuzio, R.W. Smaha, H. Sayre, X. Zhang, M.J. Bird, A.A. Cordones, G. Rumbles & O.G. Reid

https://doi.org/10.1038/s41467-025-60729-x

A scientific figure illustrating electrostatic work effects in ionic photoredox catalysis in low dielectric constant solvents. The image shows ion pair interactions between [Ir(IV)]⁺ (red sphere) and [BArF₄]⁻ (teal sphere) complexes in different oxidation states, connected by arrows indicating high ε₃ solvent conditions. A central molecular structure shows an iridium complex with CF₃-substituted ligands in a gray circular region. The diagram demonstrates how electrostatic interactions change in low dielectric environments, with molecular structures of various substrates shown around the periphery. The figure emphasizes the role of ion pairing and electrostatic work in determining reactivity patterns when the dielectric constant of the solvent is low.
A scientific illustration of an ultrafast charge transfer cascade in a mixed-dimensionality nanoscale trilayer heterostructure. The image shows a layered arrangement with WSe₂ (tungsten diselenide) as the top 2D layer, depicted with blue tungsten atoms and red/pink selenium atoms in a honeycomb lattice structure. Below is a blue mesh-like structure representing an intermediate layer, and at the bottom is a MoS₂ (molybdenum disulfide) layer shown in yellow and green atoms. Red wavy lines labeled 'hν' indicate incident light excitation, and a time constant 'τrec = 1.2 μs' indicates the charge recombination timescale. Black arrows trace the charge transfer pathway through the trilayer structure, demonstrating how photoexcited carriers move between the different dimensional materials in the heterostructure.
ACS Nano (2024)

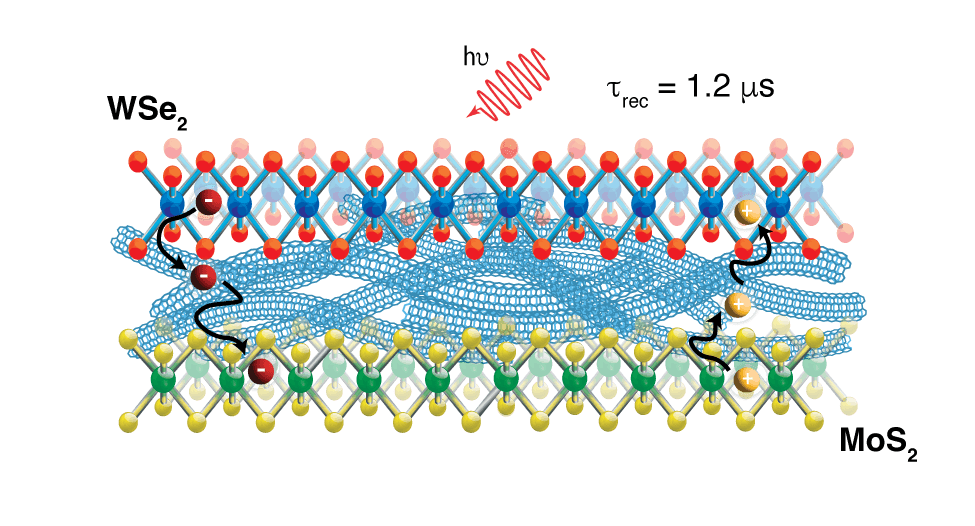
Ultrafast Charge Transfer Cascade in a Mixed-Dimensionality Nanoscale Trilayer

A. Myers, Z. Li, M. Gish, J.D. Earley, J. Johnson, M.A. Hermosilla-Palacios, J. Blackburn.

https://doi.org/10.1021/acsnano.3c12179

A mechanistic diagram illustrating ion-pair reorganization in photoredox catalysis. The central feature shows an iridium photocatalyst (Ir⁺) surrounded by multiple coordination sites with blue spheres representing ligands or counterions. Two PF₆⁻ anions (shown as brown spheres) are positioned on opposite sides, connected by green arrows indicating substrate oxidation and reduction pathways. A curved dashed arrow at the bottom labeled 'Reorganization' shows the dynamic rearrangement of the ion pair structure. The background contains faded molecular structures suggesting various substrates. The diagram demonstrates how the spatial arrangement of ionic species around the metal center changes during the catalytic cycle, affecting both the thermodynamics and kinetics of electron transfer processes.
Nature Chemistry (2022)

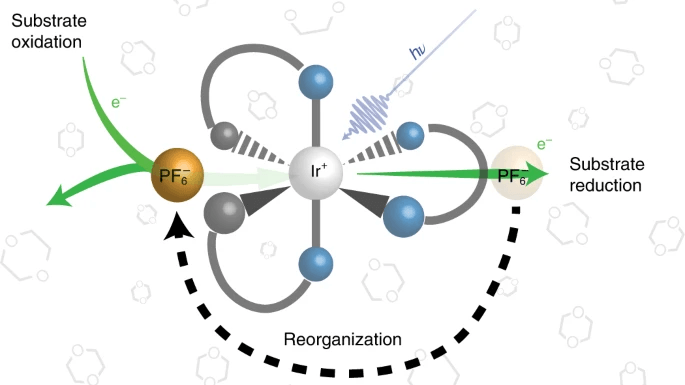
Ion-pair reorganization regulates reactivity in photoredox catalysts

J. D. Earley, A. Zieleniewska, H. H. Ripberger, N. Y. Shin, M. S. Lazorski, Z. J. Mast, H. J. Sayre, J. K. McCusker, G. D. Scholes, R. R. Knowles, O. G. Reid & G. Rumbles
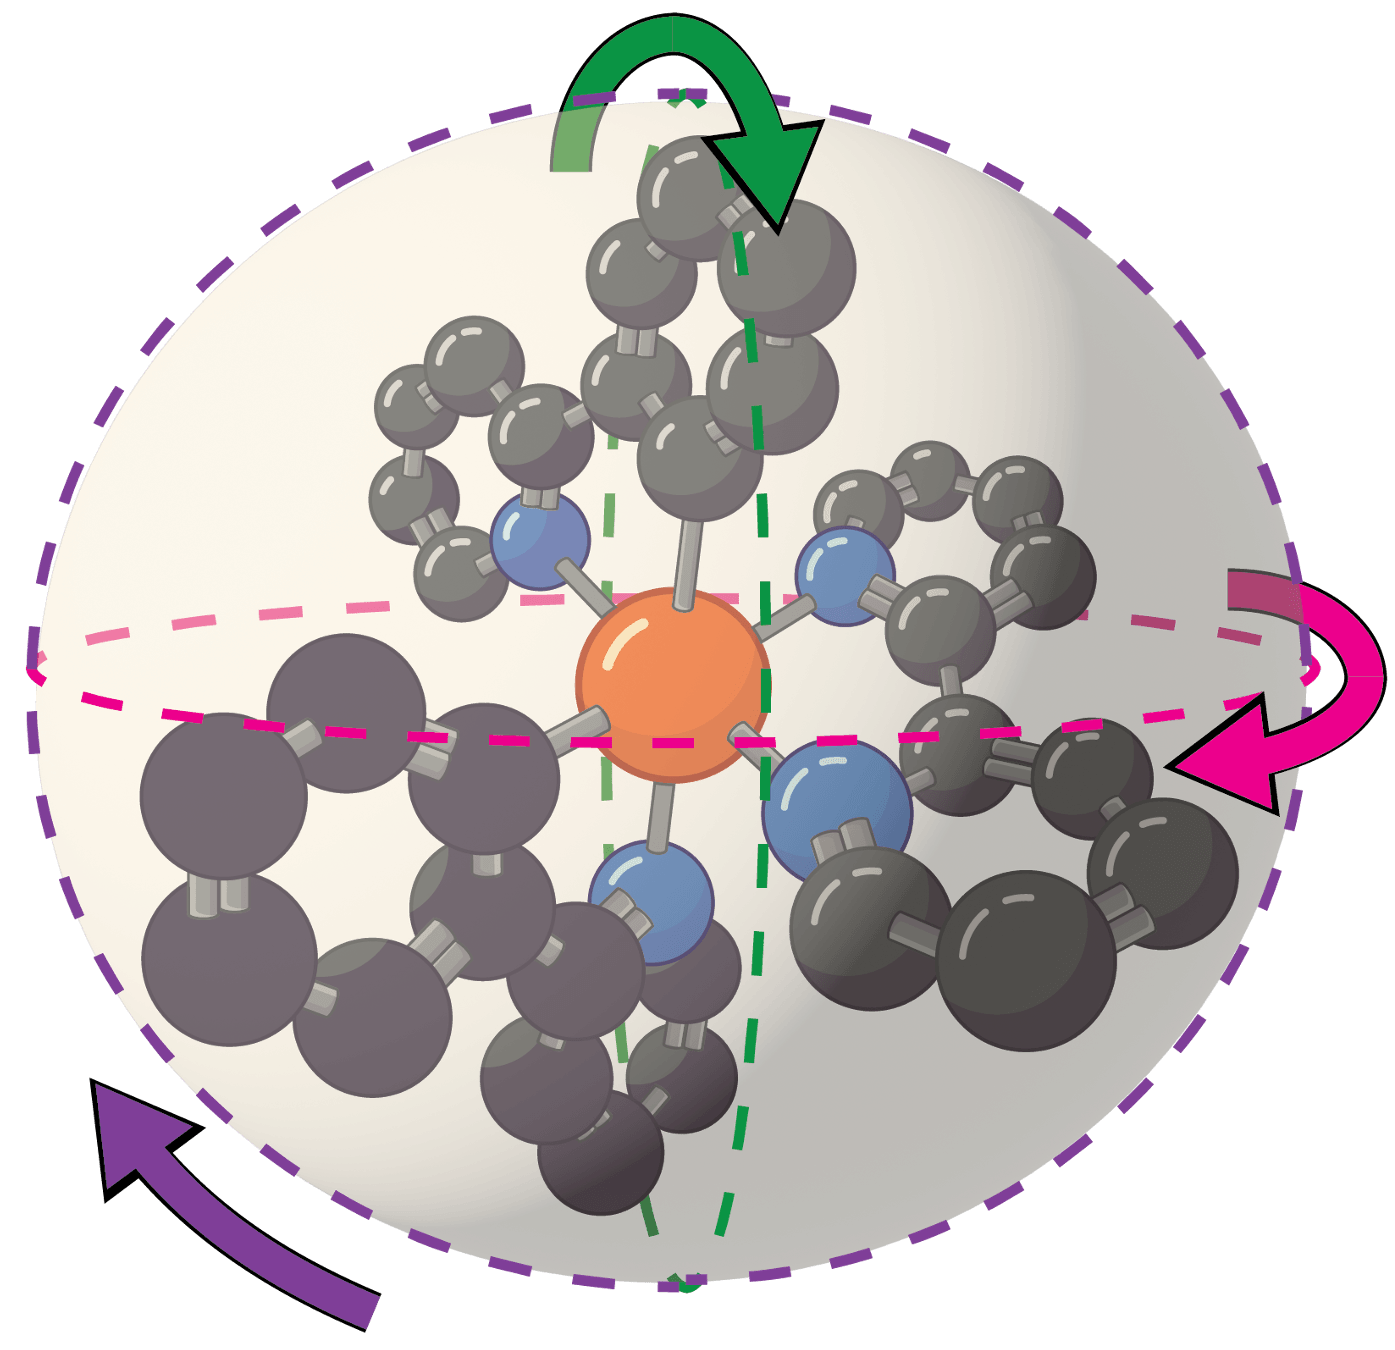
https://doi.org/10.1038/s41557-022-00911-6

A three-dimensional molecular dynamics visualization showing solution-phase molecular rotation for dipolar relaxation calculations. The image displays a central molecule (likely an organic compound with aromatic rings) shown in ball-and-stick representation with gray carbon atoms, blue nitrogen atoms, and an orange central atom. The molecule is surrounded by curved arrows in green, magenta, and purple, indicating rotational motion in different directions around multiple axes. A dashed purple circle encompasses the entire structure, representing the rotational sphere of the molecule in solution. This visualization illustrates the complex three-dimensional rotational dynamics that contribute to dipolar relaxation times in solution-phase NMR and other spectroscopic measurements.